

This is the second in a two-part series on how to create custom metrics dashboards for your app. Find the first part of the series here.
Let’s explore how to create your own plugin so you can collect custom metrics from your application. Be sure to check out the first part of this blog, where we walked through on how you can use PromEx, Prometheus and Grafana to get metrics from BEAM, Phoenix and from some other popular libraries.
As stated in the previous part of this blog, PromEx is a pluggable-style library where you add certain plugins to surface certain metrics. Let’s use the example app we built earlier and add a customizable metric to it. To do so, let’s first revisit the plugins function of the MyApp.PromEx module:
defmodule MyApp.PromEx do
  ...
  def plugins do
    [
      # PromEx built in plugins
      Plugins.Application,
      Plugins.Beam,
      {Plugins.Phoenix, router: MyAppWeb.Router, endpoint: MyAppWeb.Endpoint},
      # Plugins.Ecto,
      # Plugins.Oban,
      # Plugins.PhoenixLiveView,
      # Plugins.Absinthe,
      # Plugins.Broadway,

      # Add your own PromEx metrics plugins
      MyApp.Users.PromExPlugin
    ]
  end

  ...
We can see in the last commented lines an indication of how to proceed to add our own plugin: We will have to create a new module and add it to our plugin list.
Creating a PromEx Plugin Module
Our new plugin module will need to leverage the PromEx.Plugin behaviour and implement at least one of its three callbacks, which are: event_metrics/1, polling_metrics/1 and manual_metrics/1. Each callback represents a different way of collecting metrics and they must return a list of metrics of that type. So that means that in the same module you could define three different ways to collect metrics, and each of them could define several different metrics.
Here’s a simple overview of what the plugin module might look like:
(We have omitted the second function param, we will go into these details later.)
defmodule MyApp.Metrics.PromExPlugin do
  use PromEx.Plugin

  @impl true
  def event_metrics(_opts) do
    [
      Event.build(:http_event_metrics, ...),
      Event.build(:socket_event_metrics, ...),
      Event.build(:channel_event_metrics, ...)
    ]
  end

  @impl true
  def polling_metrics(_opts) do
    [
      Polling.build(:cpu_polling_metrics, ...),
      Polling.build(:memory_polling_metrics, ...)
    ]
  end

  @impl true
  def manual_metrics(_opts) do
    Manual.build(:application_manual_metrics, ...)
  end
end
Each entry is a struct created by the function Event.build/2, Polling.build/4 or Manual.build/3.
Note that we’re returning a single entry instead of a list in manual_metrics/1. You can do this for all the metric types in cases where you only need one.
This was just a superficial overview of what a plugin that implements the three callbacks could look like. Now we’re going to create an example with the event_metrics/1 callback to illustrate some of its implementation details.
Let’s imagine that our app is a game! To start collecting specific metrics from players, first we would have to create a new plugin and then add it to the plugins list. Let’s do it!
Create the plugin:
defmodule MyApp.Players.PromExPlugin do
  use PromEx.Plugin
end
Add it to the plugins list:
defmodule MyApp.PromEx do
  ...

  def plugins do
    [
      # PromEx built in plugins
      Plugins.Application,
      Plugins.Beam,

      ...

      # Add your own PromEx metrics plugins
      MyApp.Players.PromExPlugin
    ]
  end
  ...
end
Now let’s get this plugin to start exposing some metrics.
Adding Metrics to the Event Metrics Callback
These metrics are based on events that occur in the app emitted by the function :telemetry.execute/3. If, for example, we want our plugin to expose the count of enemies defeated by the player, we would first have to execute this function somewhere in the app every time an enemy is defeated:
:telemetry.execute([:my_app, :player, :enemy_defeated], %{count: 1}, %{player: player})
And to start exposing this counter, we would have to add the event_metrics/1 callback to our plugin. As said before, this callback should return a list of metrics, and each entry of this list should be represented by a PromEx.MetricTypes.Event struct.This struct is created by the function Event.build/2.
The function Event.build/2 requires two arguments:
-
group_name: Thegroup_nameshould be unique and should follow the following convention:<APPLICATION>_<SHORT_DESCRIPTION>_event_metrics. -
metrics: A collection of Telemetry.Metrics structs (distribution,counter,last_value, andsum).
The enemy_defeated metric is an example of a counter metric. We could think of more events that are happening in our game to exemplify the other metric types:
- Enemies Defeated:
counter - Gold collected:
sum - Last level reached by the player:
last_value - Distribution of connection time in hours among players:
distribution
We’ll start by creating a counter metric for the enemies defeated. We can put the event name that will be dispatched by :telemetry.execute/3 into a module attribute. By doing that we make it more visible and reusable:
defmodule MyApp.Players.PromExPlugin do
  use PromEx.Plugin

  @player_enemy_defeated_event [:my_app, :player, :enemy_defeated]
end
After that, we implement the event_metrics/2 callback by returning a list with the enemy_defeated metric.
defmodule MyApp.Players.PromExPlugin do
  use PromEx.Plugin

  @player_enemy_defeated_event [:my_app, :player, :enemy_defeated]

  @impl true
  def event_metrics(_opts) do
    [
      player_general_event_metrics()
    ]
  end

  defp player_general_event_metrics do
    Event.build(
      :my_app_player_general_event_metrics,
      [
        counter(
          @player_enemy_defeated_event ++ [:count],
          event_name: @player_enemy_defeated_event,
          description: "The number of enemy defeated events that have occurred",
          tags: [:player_id, :player_name],
          tag_values: &get_player_tag_values/1
        )
      ]
    )
  end

  defp get_player_tag_values(%{player: %{id: id, name: name}}) do
    %{player_id: id, player_name: name}
  end
end
We created the definition of the enemy defeated metric by using the Event.build/2 function, which received the:my_app_player_general_event_metrics atom as the group name and, as the second argument, the counter definition.
The counter definition is created by using the Telemetry.Metrics which provides a common interface for defining metrics based on :telemetry events. See the official documentation for more information.
The counter/2 metric function receives the metric name as the first argument and a list of options as the second argument (the options list is not mandatory, as some options can be inferred using the metric name – make sure you check the official documentation to know which ones might be useful for your use case).
Let’s continue with the second example: the gold collected metric. We could imagine this game is executing the following code every time a portion of gold is collected:
:telemetry.execute([:my_app, :player, :gold_collected], %{value: value}, %{player: player})
In this example, the variable value is the amount of gold collected for each event. Since we don’t want to count every time gold is collected, we want the sum of all collected gold.
Again, we could start by defining the event name as a module attribute:
defmodule MyApp.Players.PromExPlugin do
  use PromEx.Plugin

  @player_enemy_defeated_event [:my_app, :player, :enemy_defeated]
  @player_gold_collected_event [:my_app, :player, :gold_collected]
And we could define this metric in the same group as the enemy defeated metric:
defmodule MyApp.Players.PromExPlugin do
  use PromEx.Plugin

  @player_enemy_defeated_event [:my_app, :player, :enemy_defeated]
  @player_gold_collected_event [:my_app, :player, :gold_collected]

  @impl true
  def event_metrics(_opts) do
    [
      player_general_event_metrics()
    ]
  end

  defp player_general_event_metrics do
    Event.build(
      :my_app_player_general_event_metrics,
      [
        counter(
          @player_enemy_defeated_event ++ [:count],
          event_name: @player_enemy_defeated_event,
          description: "The number of enemy defeated events that have occurred",
          tags: [:player_id, :player_name],
          tag_values: &get_player_tag_values/1
        ),
        sum(
          @player_gold_collected_event ++ [:value],
          event_name: @player_gold_collected_event,
          description: "The total gold collected by the player",
          tags: [:player_id, :player_name],
          tag_values: &get_player_tag_values/1
        )
      ]
    )
  end

  ...
end
Now we can emit some enemy_defeated and gold_collected events to start testing these metrics. Let’s wrap those event calls into a module for easier testing:
defmodule MyApp do
  def enemy_defeated do
    player = %{id: 1, name: "Hunter"}

    :telemetry.execute([:my_app, :player, :enemy_defeated], %{count: 1}, %{player: player})
  end

  def gold_collected(value) do
    player = %{id: 1, name: "Hunter"}

    :telemetry.execute([:my_app, :player, :gold_collected], %{value: value}, %{player: player})
  end
end
Make sure Phometheus and Grafana are running and then, start your Phoenix server:
iex -S mix phx.server
Let’s emit some events:
iex(1)> MyApp.enemy_defeated()
:ok
iex(2)> MyApp.enemy_defeated()
:ok
iex(3)> MyApp.enemy_defeated()
:ok

iex(4)> MyApp.gold_collected(53)
:ok
iex(5)> MyApp.gold_collected(79)
:ok
And now let’s do a a step by step to see if everything is working:
First let’s check if those metrics are accessible through the /metric endpoint. Go to the URL localhost:4000/metrics and search for the enemy_defeated and gold_collected events. They should be at the end of the page:
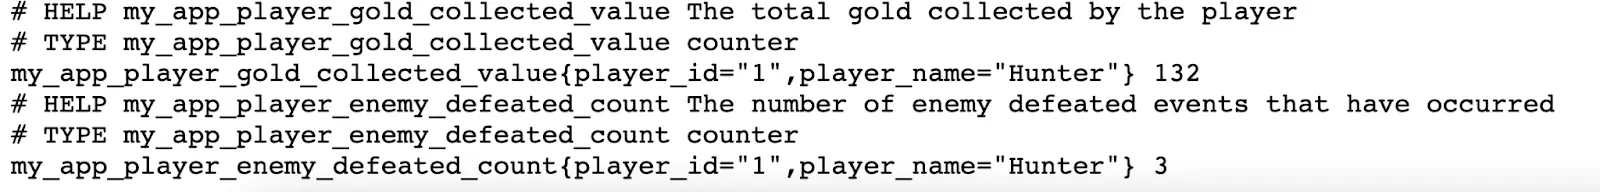
We can see the result of the counter of enemies defeated, which is three, and also a total of 132 gold, which is the sum of the collected gold . Our metric is working. So that means these metrics are already available for Prometheus to scrape them.
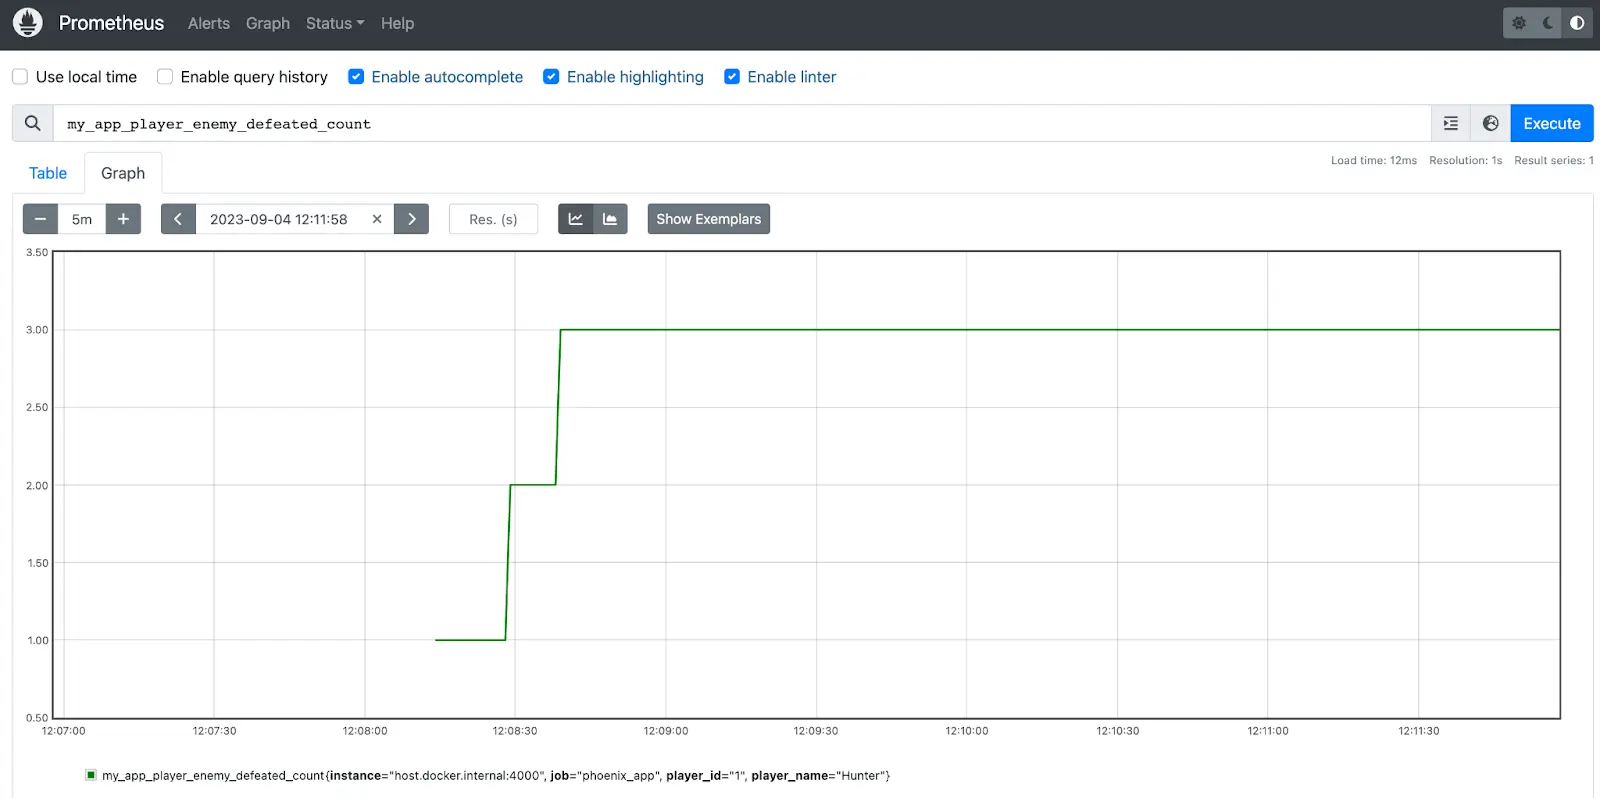
Let’s check if Prometheus was already able to collect and store them. Go to the Prometheus URL http://localhost:9090/ and search for the metric my_app_player_enemy_defeated_count. If you click in Graph and adjust the time range, you might see something like this:
Finally, let’s create a Grafana dashboard example to see its ability to query Prometheus for data:
- Go to the Grafana URL http://localhost:3000/
- Enter the Dashboards menu.
- Click on the “New” button and select the “New Dashboard” option.
- Click on the “Add Visualization” button.
- In the Data source option, make sure that the data source we created earlier is selected, in my case it is called
my_prometheus_datasource_name - Let’s use the “Metric” field to look up metrics via autocompletion. We can search for “gold” to find the gold_collected metric.
- Click on the button “Run Queries”.
If you zoom in (you can change the range to the last 15 minutes), you can see a graph similar to this one:
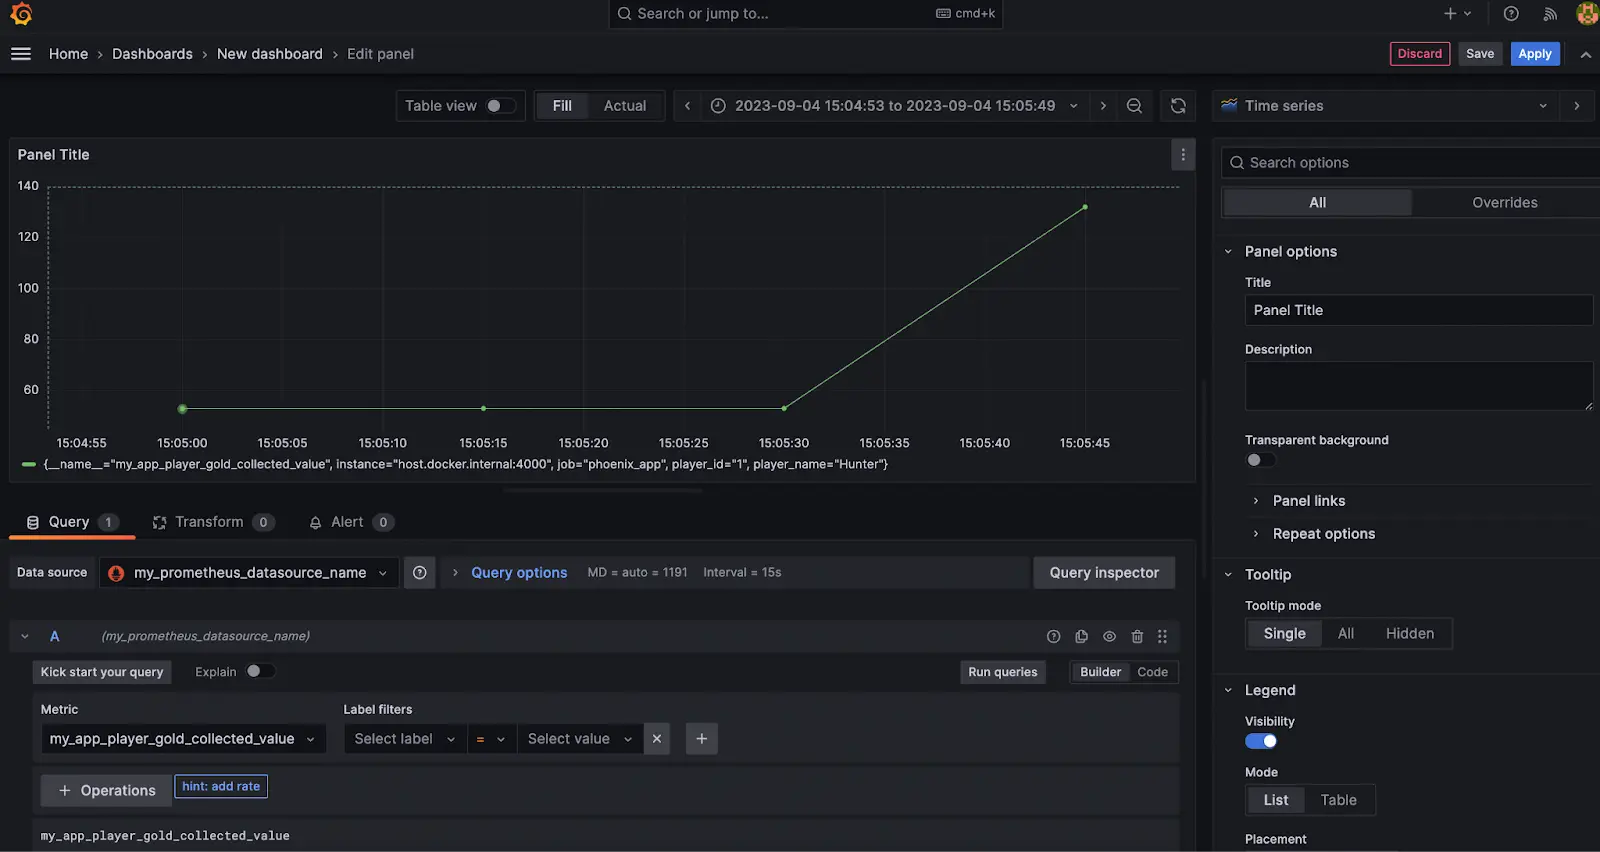
The data points shows an increase from 53 gold coins collected to 132 - Everything is working as expected 🎉.
We can continue to grow our Plugin module with more metrics - let’s see how it would look with the addition of the last two metric types that we listed earlier.
Last level reached by the player: last_value
:telemetry.execute([:my_app, :player], %{current_level: level}, %{player: player})
Distribution of connection time in hours among players: distribution
:telemetry.execute([:my_app, :players, :connection_time], %{duration: duration})
And we could wrap those event calls into a module for easier testing:
defmodule MyApp do
  ...

  def level_up(current_level) do
    player = %{id: 1, name: "Hunter"}
    level = current_level + 1

    :telemetry.execute([:my_app, :player], %{current_level: level}, %{player: player})
  end

  def player_disconnected(duration) do
    :telemetry.execute([:my_app, :players, :connection_time], %{duration: duration})
  end
end
And this would be our plugin module in its final form:
defmodule MyApp.Players.PromExPlugin do
  use PromEx.Plugin

  @player_enemy_defeated_event [:my_app, :player, :enemy_defeated]
  @player_gold_collected_event [:my_app, :player, :gold_collected]
  @player_disconnected_event [:my_app, :players, :connection_time]

  @impl true
  def event_metrics(_opts) do
    [
      player_general_event_metrics(),
      player_stats_event_metrics(),
      players_distribution_event_metrics()
    ]
  end

  defp player_general_event_metrics do
    Event.build(
      :my_app_player_general_event_metrics,
      [
        counter(
          @player_enemy_defeated_event ++ [:count],
          event_name: @player_enemy_defeated_event,
          description: "The number of enemy defeated events that have occurred",
          tags: [:player_id, :player_name],
          tag_values: &get_player_tag_values/1
        ),
        sum(
          @player_gold_collected_event ++ [:value],
          event_name: @player_gold_collected_event,
          description: "The total gold collected by the player",
          tags: [:player_id, :player_name],
          tag_values: &get_player_tag_values/1
        )
      ]
    )
  end

  defp player_stats_event_metrics do
    Event.build(
      :my_app_player_stats_event_metrics,
      [
        last_value(
          [:my_app, :player, :current_level],
          tags: [:player_id, :player_name],
          tag_values: &get_player_tag_values/1
        )
      ]
    )
  end

  defp players_distribution_event_metrics do
    Event.build(
      :my_app_players_distribution_event_metrics,
      [
        distribution(
          @player_disconnected_event ++ [:duration],
          event_name: @player_disconnected_event,
          description: "The time spent in hours before disconnecting from the game.",
          reporter_options: [buckets: [1, 2, 4, 8, 16, 32]]
        )
      ]
    )
  end

  defp get_player_tag_values(%{player: %{id: id, name: name}}) do
    %{player_id: id, player_name: name}
  end
end
Notice that this time we chose to separate these two new metrics into different groups, and also notice that we used a different list of options for each one of them. Again, be sure to check out the official documentation of the Telemetry.Metrics interface to learn different ways you can create a metric.
Restart the server and let’s emit more events:
iex(7)> MyApp.player_disconnected 3
:ok
iex(8)> MyApp.player_disconnected 5
:ok
iex(9)> MyApp.player_disconnected 1
:ok
iex(10)> MyApp.player_disconnected 9
:ok
iex(11)> MyApp.player_disconnected 4
:ok
iex(12)> MyApp.player_disconnected 7
:ok
iex(13)> MyApp.player_disconnected 1
:ok
iex(13)> MyApp.player_disconnected 40
:ok
iex(13)> MyApp.player_disconnected 2
:ok
Go to the dashboard again and look up for the connection_time metric and choose my_app_players_connection_time_duration_bucket. Run the query and you would see a graph like this:
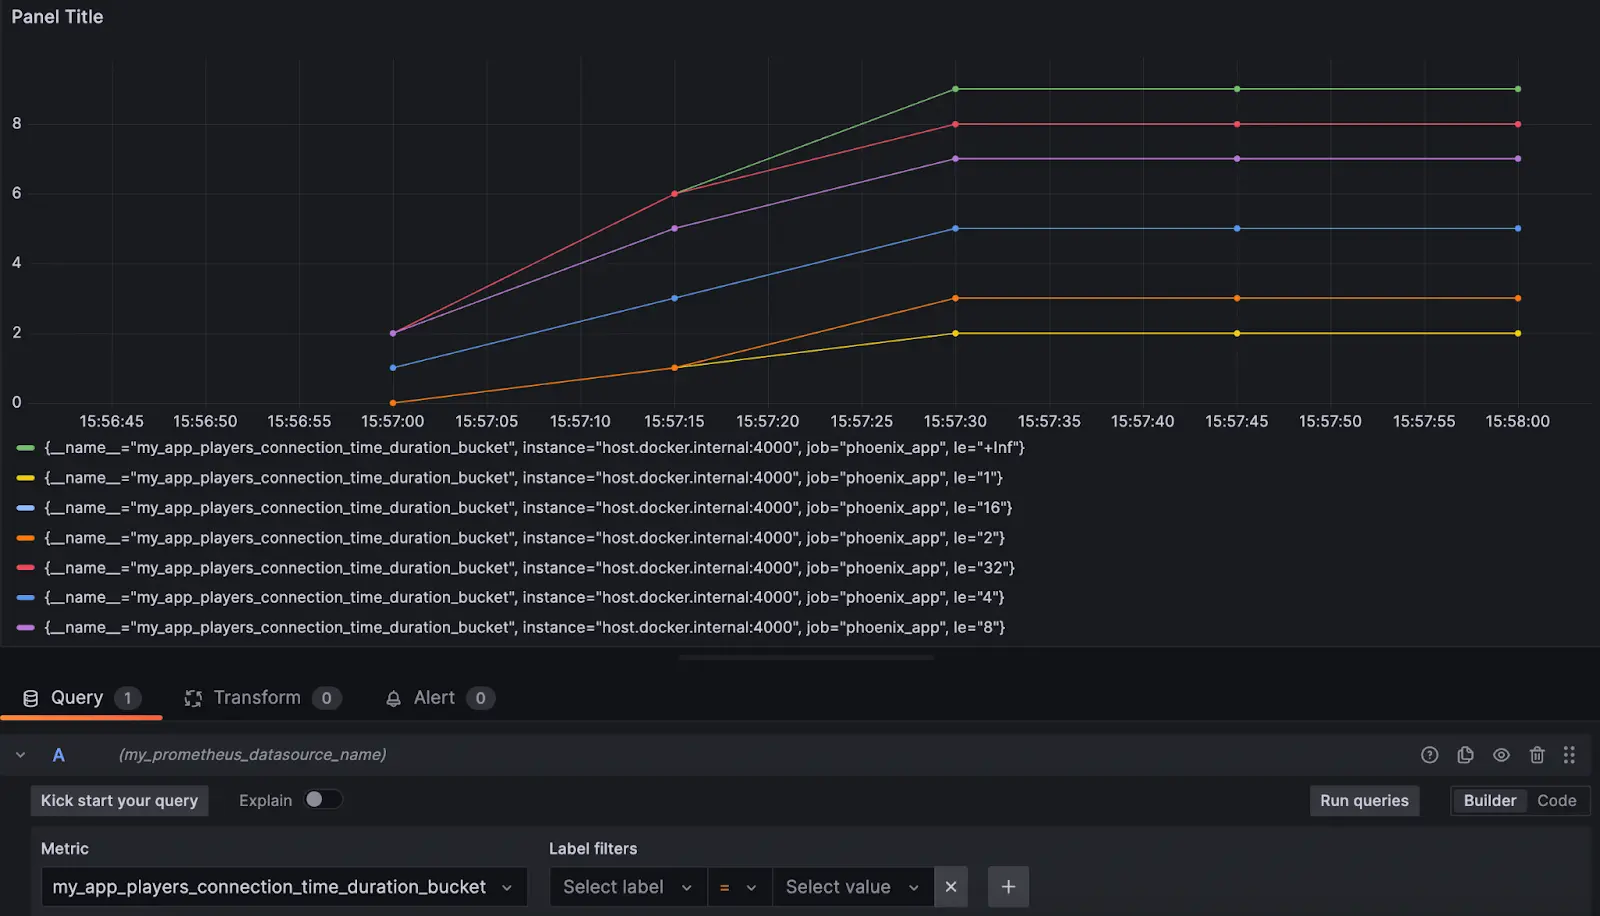
In this graph we can see the distribution of players in the buckets we defined: buckets: [1, 2, 4, 8, 16, 32]. For example, if we analyze the orange line, we can read that three players were connected for up to two hours.
Polling and Manual Metrics Callback
This was an overview of how to define event metrics using PromEx. As said at the beginning of the blog, you still have the option of using two other callbacks: polling_metrics/1 and manual_metrics/1.
You can create Polling metrics in a similar way to event metrics, but the Polling.build/4 function would require two more arguments: the measurements_mfa and a poll_rate. Basically the Polling metric will execute the specified function (mfa) at the specific interval defined by the poll_rate argument. So the difference from the Event metrics is that you collect the metrics periodically instead of collecting only when an event occurs in your system.
With Manual metrics, you don’t need to give a poll_rate. The measurements_mfa will be called once on application start and it is up to the user to call PromEx.ManualMetricsManager.refresh_metrics/1 to refresh the data point.
You can read more about those callbacks and see some examples by checking the PromEx guide: Writing PromEx Plugins.
Conclusion
Throughout these two blog posts we saw that PromEx makes it easier to integrate your Phoenix application with Prometheus and Grafana services. In addition, the library already comes with several pre-installed plugins and dashboards from the most famous libraries of the Elixir/Phoenix ecosystem. Its ‘Plug-in’ style makes it convenient to manage the metrics you want, and since it leverages the existing Telemetry APIs, it’s easier to integrate with the metrics from third-party libraries and also to add your own metrics.
References for further reading:
Whether you need in-the-weeds metrics or a complete app overhaul, our team can help you get it done. Get in touch today to learn how we can help you reach success, faster.
